Economic Insight Note – Q1 2017
United States of America economic growth in the post-great recession era: 2008-2016
Quick reading:
The US economy is struggling to find an appropriate response to the economic crisis of 2008-2009 and its aftermath. The protracted low economic growth across the country of only 1.3 percent on average per year in the last nine years, with the exception mainly of the crude oil and gas producing states, and almost flat GDP per capita represent a major challenge to the US policy-makers and the new administration. Despite significant deployment of supposedly powerful fiscal and monetary policies, the economic malaise has persisted.
The international standing of the growth performance of the US economy, in particular when compared with Germany, which managed to increase its GDP per capita at the double rate of the US while lowering its public debt, adds an additional puzzle as to the US capacity to return to its long-term growth path.
United States of America economic growth in the post-great recession era: 2008-2016
The US economy has not yet shaken off the 2008-2009 economic crisis: the real GDP growth with 1.3 percent per year in the last nine years is almost 60 percent below the long-term trend while the GDP per capita grew on average only 0.5 percent annually (Chart 1).1
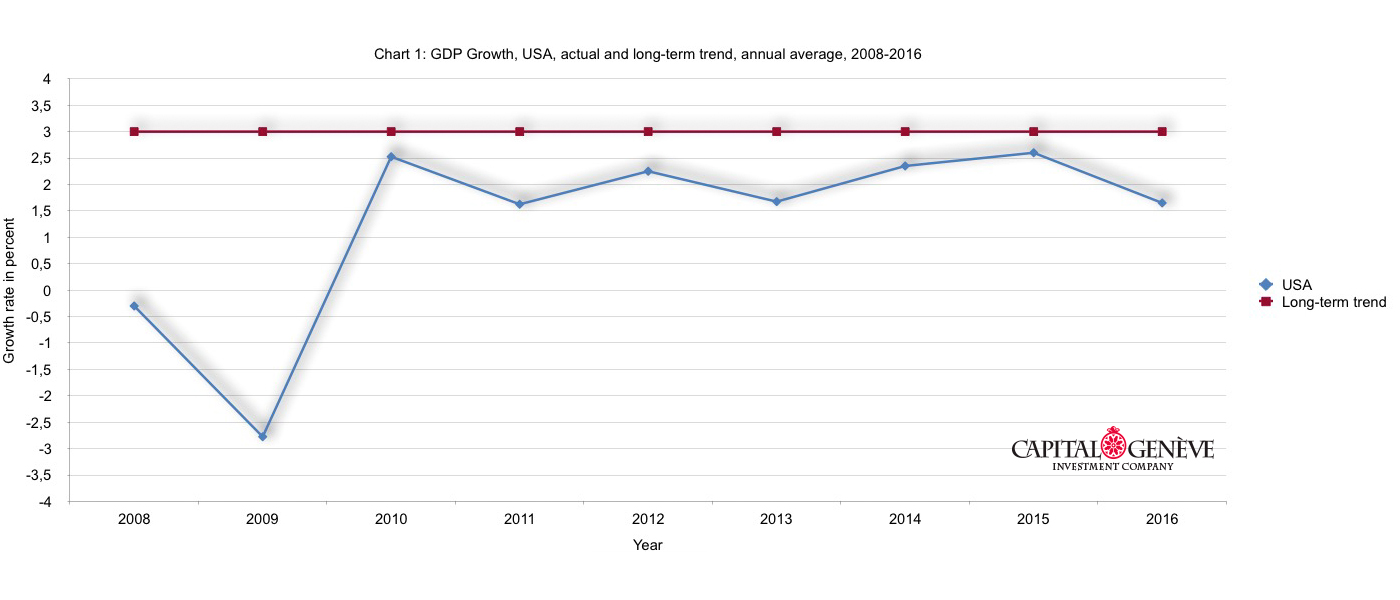
Chart 1: GDP Growth, USA, actual and long-term trend, annual average, 2008-2016
Such a disappointing growth performance coupled with marginally increasing total employment of 0.4 percent per year points to low productivity improvements in the US economy: around 1 percent on average per year. Indeed low by the historical standards, the US productivity is not only a main indicator of the current economic strength but also a reliable predictor of the near-future growth performance.
The economic malaise, characterised by protracted low economic growth, has hit almost all federal states. Only four federal states, Nebraska, North Dakota, Oklahoma and Texas, achieved higher average annual growth rates than two percent while Texas alone has generated 25 percent of all economic growth in the United States in the same period (Chart 2). Furthermore, Texas, Oklahoma and North Dakota lead the nation in the increasing crude oil production with all three more than doubling the oil output during 2011-2015.
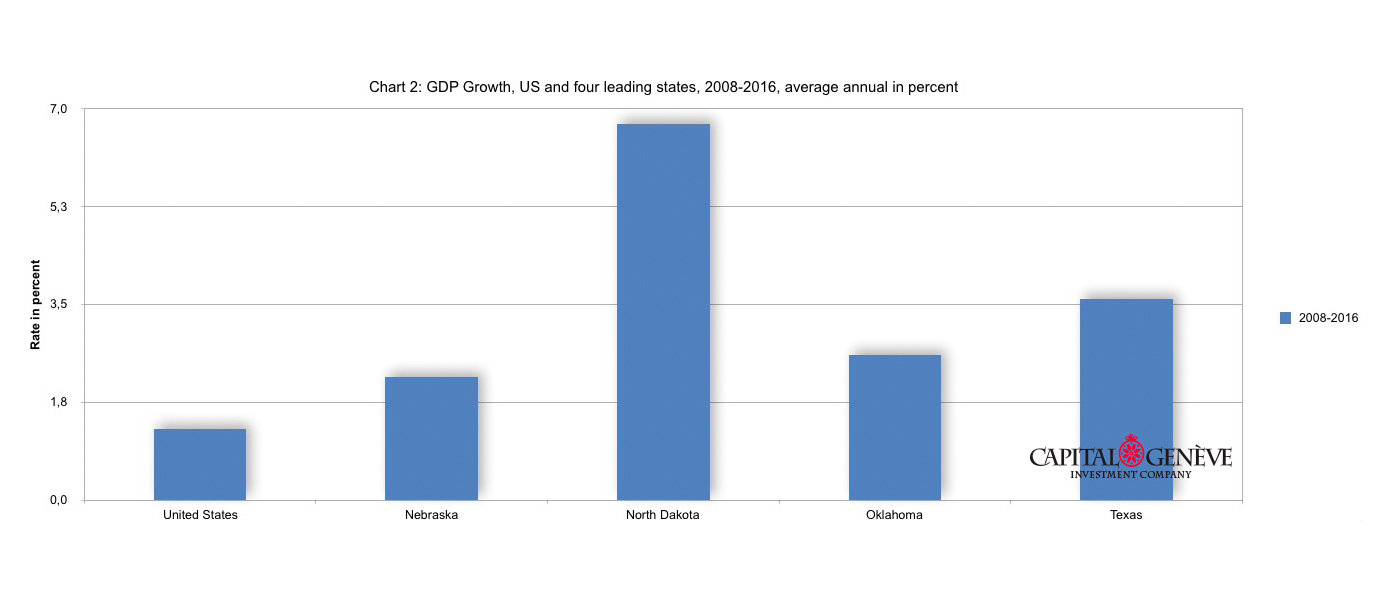
Chart 2: GDP Growth, US and four leading states, 2008-2016, average annual in percent
In the same four years, North Dakota and Oklahoma enlarged their natural gas production five times and 50 percent, respectively. Three other states, which experienced the GDP growth around the national average also augmented the natural gas production: Ohio 20 times, Pennsylvania four times and West Virginia three times. Those sharp gas production increases in turn made the US the world largest natural gas producer with the future gas output augmentation being only demand-constrained.2
The expansion of the crude oil and natural gas output in those six key federal states for the economic growth in the United States in the last ten years has been made possible by massive productivity increases. For example, the productivity of new-well crude oil and natural gas rigs augmented 1’300 percent and 390 percent respectively, making an average industry operator in shale oil and gas more profitable today at the crude oil price of USD 50 / barrel then four years ago when the crude oil was priced at USD 120 / barrel.3
That spectacular productivity improvement has resulted in a sharply increased crude oil and gas output, steeply reduced crude oil and gas prices and de facto a large debt-free fiscal stimulus to the US consumers of approximately USD 740 billion in 2015 and 2016 or almost 4 percent of GDP in 2016 (Chart 3). As a comparison, The American Reinvestment and Recovery Act of 2009 equalled USD 787 billion or 5.7 percent of the US GDP in 2008.
In addition, the growing US crude oil and gas industry allowed savings of USD125 billion in the crude oil imports in 2014-2016 when compared to 2013.
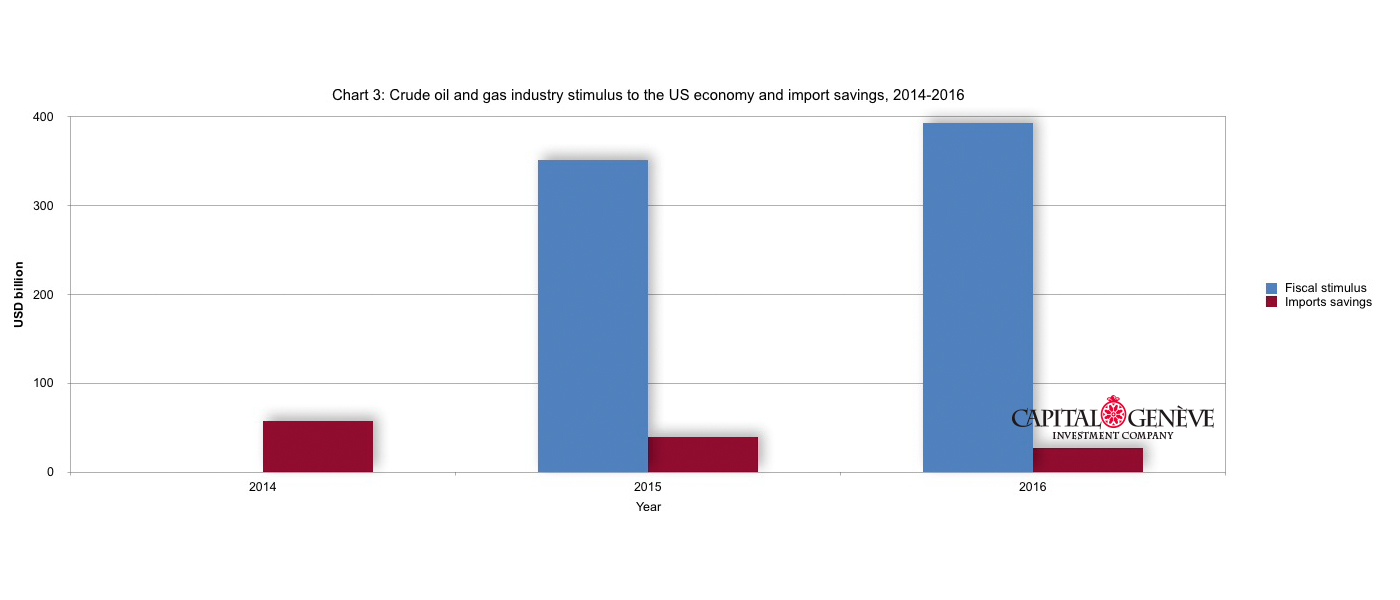
Chart 3: Crude oil and gas industry stimulus to the US economy and import savings, 2014-2016
It could be expected that these debt-free fiscal stimuli, all other things kept equal, would make the personal consumption expenditures the most dynamic GDP growth component in 2015 and 2016, which indeed was the case.4
Although there seem to be the reasons to put trust into the California’s, Massachusetts’ and New York’s significant orientation on “New Economy” including information technologies, pharmaceuticals and advanced financial intermediation, respectively, as the main driver of the future US economic growth, their relative contribution of to the US GDP growth is significantly lagging behind the crude oil and gas producing states.
Volatility of the US GDP growth in the last nine years has been subdued, with standard deviation of 1.8 percent, which is quite low compared to the recent historical standards of at least 2.0 percent. Such a low GDP volatility indicates that either the monetary and fiscal policies are tampering with the business cycles or that the business sector has learnt to manage the cycles and to adjust its capital stock to variable business conditions, both at the price of a lower than expected GDP.
How does the US economic growth performance compares internationally?
A comparison with Germany, which employed a different response to the economic crisis in 2008-2009 and its aftermath, is instructive: while the German GDP grew slightly slower that the GDP of the US, around 1.0 percent on average per year during 2008-2016, its GDP per capita growth was almost double when compared to the US: 1.0 percent versus 0.5 percent (Charts 4 and 5). Furthermore, the US GDP per capita growth is just equal to that achieved by EU-28 in the same nine years.5
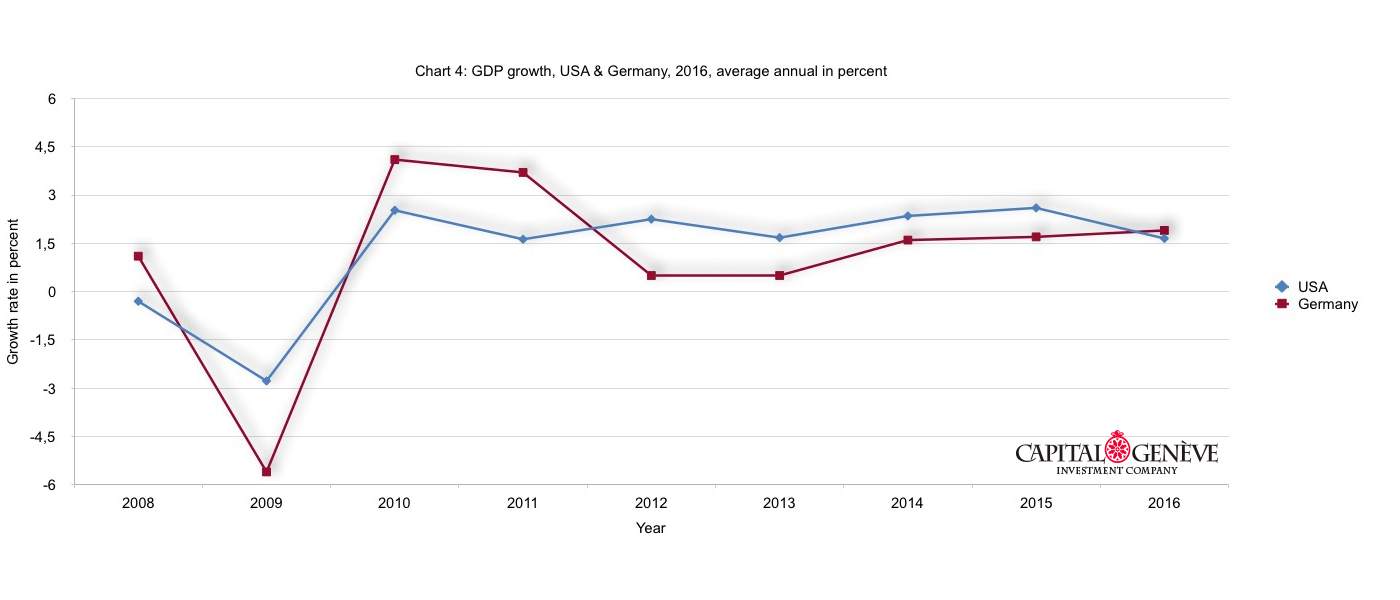
Chart 4: GDP growth, USA & Germany, 2016, average annual in percent
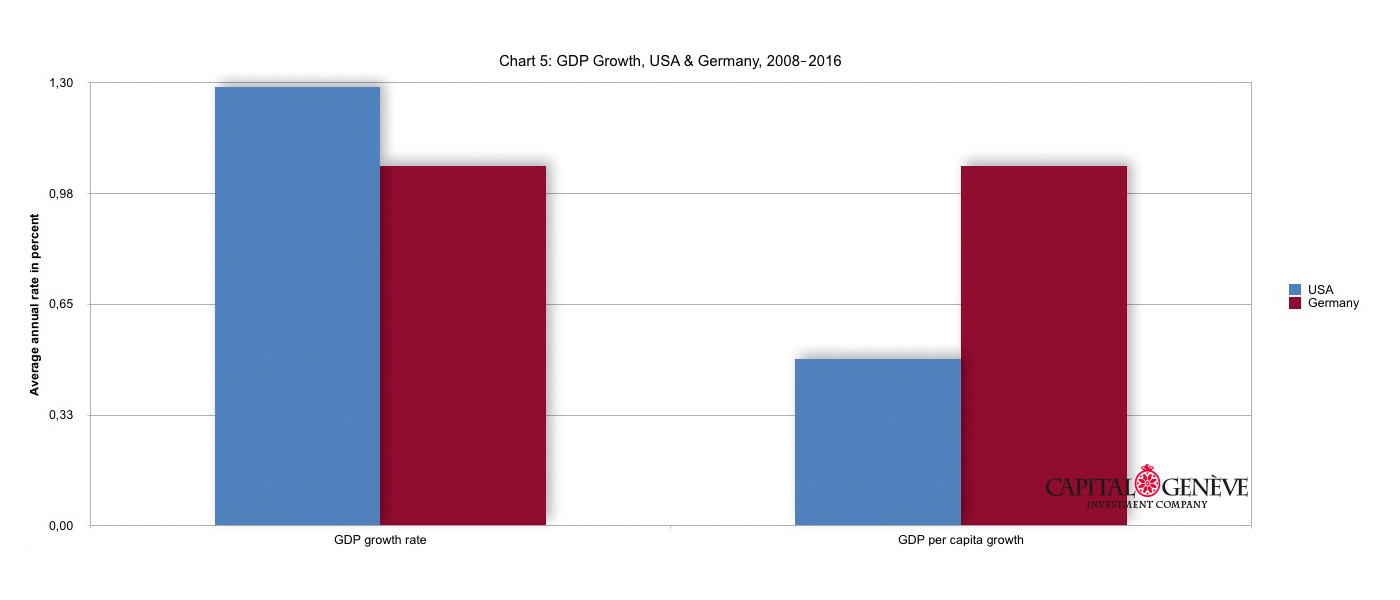
Chart 5: GDP Growth, USA & Germany, 2008_2016
Interestingly enough, the German GDP growth volatility was much higher: 2.8 percent per year, which might indicate, all other factors being equal, that there was less government tampering with business cycles and related economic restructuring (Chart 6).
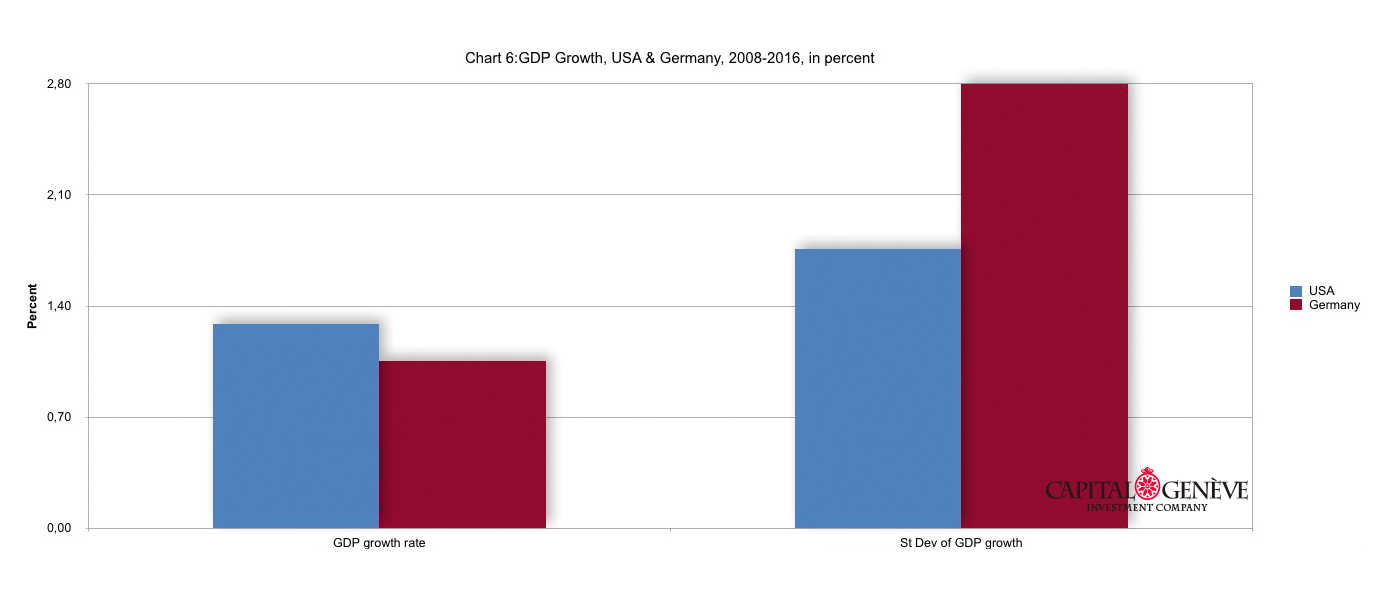
Chart 6:GDP Growth, USA & Germany, 2008-2016, in percent
The different nature of the macroeconomic response to the economic crisis and its aftermath by the USA and Germany the most clearly could be observed by their attitude towards public debt. The verdict of the last six years on the hotly debated issue on the most appropriate way to return to the sustainable growth path has been visibly in favour of the German model (Chart 7).6 With the similar starting levels of the public debt / GDP ratio in 2010 and with the US continuing to increase its public debt, albeit at slower rates, Germany has been reducing it. In comparison to 2010, the US ratio of public debt to GDP in 2015 increased 10 percentage points while Germany reduced the same ratio in the observed period for 10 percentage points. Thus, while the increase in one percentage point of the German GDP did not require any increase in the public debt7, the annual increase in one percentage point of the US GDP required on average also the increase of the public debt of one percentage point. The fact that the German debt / GDP efficiency line lays below x-axis means that its GDP grew while the debt has been reduced. On the contrary, the US debt / GDP efficiency line lays above x-axis since increase in the public debt is required for the US GDP to grow (Chart 8). At the same time, the GDP growth performance of both countries is quite similar in a statistically significant manner.8
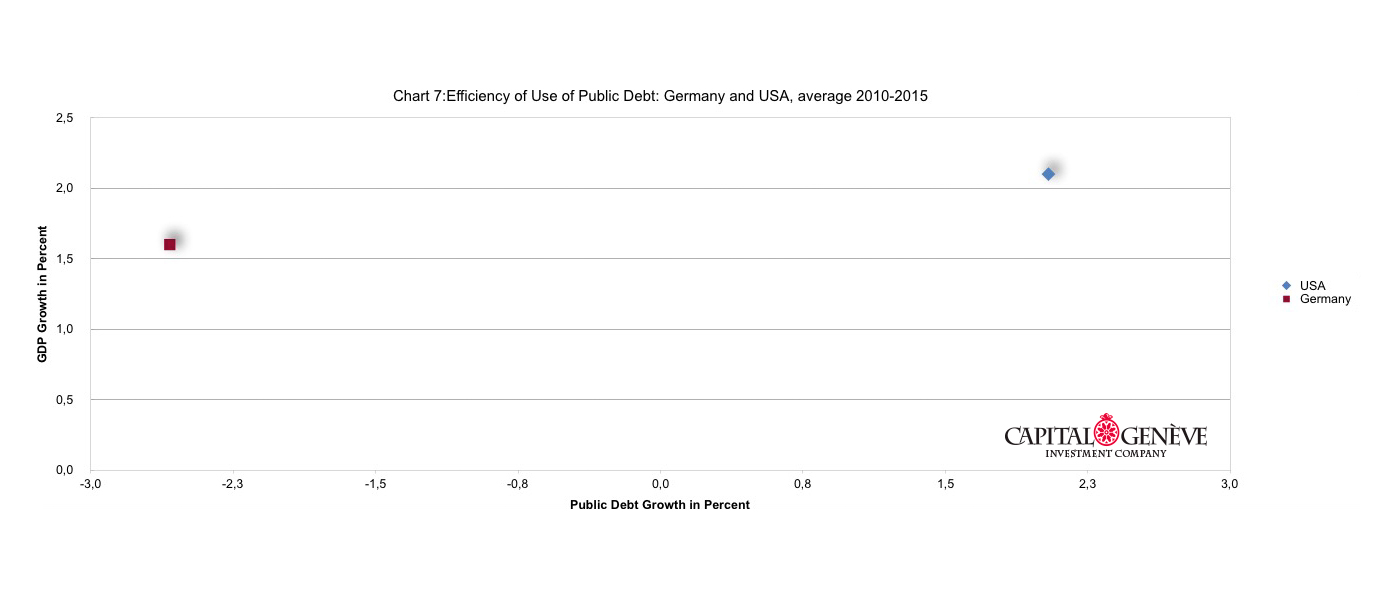
Chart 7:Efficiency of Use of Public Debt: Germany and USA, average 2010-2015
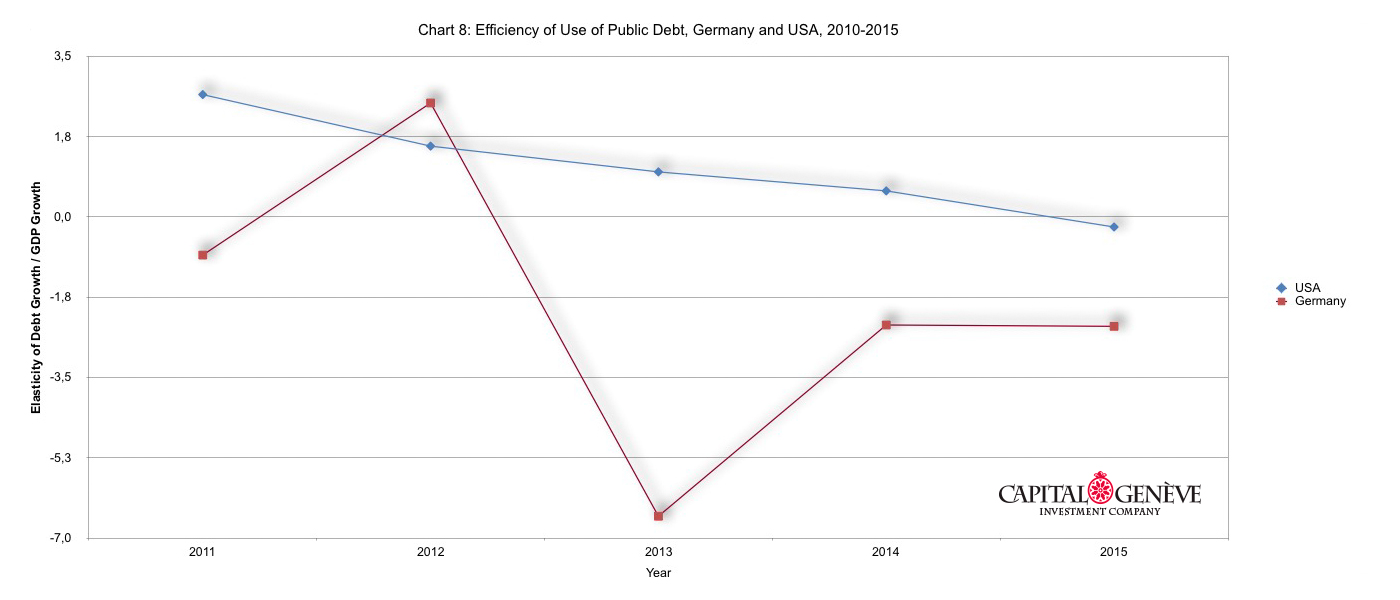
Chart 8: Efficiency of Use of Public Debt, Germany and USA, 2010-2015
Although the time series is quite short, only six years, and we have only two countries in the sample, a clear conclusion on the irrelevance of (the increasing) public debt for the economic growth in this particular period emerges: whether those two countries increased or decreased public debt, their economies grew.9
When the stars align – could the Texas’ success be emulated on the national scale?
At the recent Bloomberg New Energy Finance The Future of Energy Summit, held in New York on 24-25 April 2017, HE Mr. Rick Perry, the newly appointed US Secretary of State, stated that President Trump had asked him to “do for the United States what he did for Texas” (in energy).
The potential for applying the Texas’ energy experience across the US is certainly large.
The issue is though bigger than replicating the Texas’ spectacular success in energy, which consist of: a sharp increase in crude oil and gas production, a multiplicative increase in natural gas reserves, replacement of Saudi Arabia as the world swing producer, certainty that the US will become the world biggest LNG exporter in medium-term, redefinition of the energy security of the US, its Western European allies and Japan as well as putting rapidly and well ahead of schedule in place the largest fleet, over 20’000 MW of wind power plants, in United States.
The question is whether the Texas economic model could be applied on the US economy as a whole including the generation of new preferably non-disruptive, fundamentally important technologies with a large positive impact on GDP, capital formation and employment, returning the US economy to its long-term GDP growth trend and reinforcing its world leadership.10
It might be worthwhile to reflect on whether the Texas’ success in energy and the economic growth in the observed period might well be the result of a combination of perhaps unique factors: availability of large pools of capital, deep technological and financial expertise, steady state government hand, market predictability and industrial / political will to respond to strong external incentives (very high international crude oil price) and major, existential threats (energy security of US and its allies) as well as the entrepreneurial culture and competitive market setting in crude oil and natural gas sectors. Such a truly economic and innovative background combined with a perfect window opportunity timing set by the crude oil market manipulation of OPEC and Russia as well as the emergence of China as the key crude oil buyer since approximately 2004, speeded up the true technological breakthrough in the form of hydraulic fracturing and directional drilling in crude oil and gas industry.
As such the fracturing and drilling technology is a world-wide relevant add-on technology, opposite to a disruptive one, with a positive net present value for the energy sectors and the national economy. There is no significant potential for the product cannibalization or disruption of already existing crude oil and gas producers.
The hydraulic fracturing and directional drilling technology diffusion in a market with a deep division of labour, thousands of actors and permanent improvement in its performance stands in a sharp contrast with, for example, the disruptive information technologies often considered as a key potential source of the US economic growth. Apart from other effects, those technologies have initiated a massive cannibalization, also a part of economic development, in the newspapers and TV business, retail, travel and advertising with additional areas of the US economy to be shortly affected. On their way and without always delivering better good / service and lower price compared to the cannibalized products, they as well rapidly created either monopolistic or oligopolistic market structures.
For the key information technology companies to create positive net present value added, relevant add-on technologies with large economic growth, capital formation and employment potential, they would need to answer to precise economic, political and security threats and opportunities of the national and international importance comparable to those to which the Texas’ crude oil and gas sector so efficiently responded. Finally, such technologies would need to demonstrate the capability to create fiscal stimuli, which the shale oil and gas industry engineered in 2015 and 2016. The information technology sector certainly missed a great opportunity to exert the national economic leadership during the 2008-2009 economic crisis and its aftermath and failed to pull the US economy out of the protracted economic malaise.
Towards the long-term growth trend
While an array of monetary, fiscal and regulatory policies could be employed by the new US administration to try to revive the economic growth, the persistence of the economic malaise in the last nine years points to the existence of deep incentive, structural and technological problems across the US economy. The US comparably low efficiency in using public debt for economic growth is just one manifestation of those issues.
A lesson perhaps to retain by the new US administration from the current nine-year economic growth episode is that the right set of incentives, well beyond simple tax and foreign trade policies, as well as the relevant technology creation responding to the key societal and economic needs, could be more powerful and lasting than large monetary and fiscal stimuli.
Please direct your enquiries to: partners@capitalgeneve.ch
*****
1 The raw US GDP and population data are from the US Bureau of the Economic Analysis. All calculations in the Note are performed by CapitalGenève’s staff.
2 World gas production data are taken from BP Statistical Review of World Energy 2016.
3 Data sources: US Energy Information Administration, oil companies’ corporate reports and disclosures and CapitalGenève’s data and calculations.
4 Please consult: https://bea.gov/newsreleases/national/gdp/2017/pdf/gdp1q17_adv.pdf
5 Raw data source for EU and Germany: Eurostat. Calculations: CapitalGenève’s staff.
6 Source of data for public debt: IMF Survey. CapitalGenève’s staff performed all calculation.
7 At the opposite, the Germany economy grew while reducing the public debt by -2.6 percent per year.
8 The Pearson correlation coefficient r=0.83; p-value of T-test at 0.05 =0.83 (differences in growth rates means insignificant) and p-value of F-test at 0.05 = 0.21 (differences in growth variances insignificant).
9 A visual inspection of ten available pairs of data on the changes in public debt and GDP indicates that, in this particular period and for the cross-section of only those two countries, the correlation between the two variables might be non-existent. And indeed, the Pearson correlation coefficient is only -0.04.
10 Robert J. Gordon, The Rise and Fall of American Growth: The US Standard of Living since the Civil War, The Princeton University Press, 2016, discusses at length the meaning of fundamentally important inventions.
© 2017 CapitalGenève Limited. Reproduction not permitted. When citing please refer to: CapitalGenève Limited: Economic Insight Note Q1 2017.